The role of Maps in orientation and localization
Logistics
- Quick google form to get your feedback on the course
- Quick review of the structure of the course: The “Big Ideas”
- Prev: 8: Teleop-bot
- Next: 9a: Building Maps
Maps in ROS
- Our focus is mobile, ground based robots
- In ROS maps are represented as a 2d grid
- Each dot in the grid corresponds to a square in the real world (based on the resolution of the map)
- Black dots: walls (not passable)
- White dots: open space (passable)
- Grey dots: Unknown
mymap.yaml
- Maps in fact are stored as images - .png, .jpg, .pgm
- You can edit them in any appropriate image editing tool
- Accompanying YAML file defines mapping between image and real world
- Map = *.png + *.yaml
- Example
# contents of mymap.yaml

image: map.pgm
resolution: 0.1
origin: [0.0, 0.0, 0.0]
occupied_thresh: 0.65
free_thresh: 0.196
negate: 1
Definitions
- image: filename
- resolution: in meters, how large a square in the real world does one pixel represent
- origin: What is the real world coordinate of the pixel in the [0,0] position
- occupied_thresh: pixels with color value greater than this number are considered occupied
- free_thresh: pixels with color value less than this number are considered free. (Values in between are considered unknown)
- negate: Depending on whether black is 1 or black is 0 in the image representation, it might have to be negated
Building Maps
- Maps that are made via Lidar or other sensors will be somewhat rough
- Walls may not be exactly straight and will be blocky
- We’re going to experiment with the
gmappingpackage (see reference) - Simulated robot in simulated space
- Collect sensor data in a bag
- Then generate a map from it
Phase 1: Simulated Robot
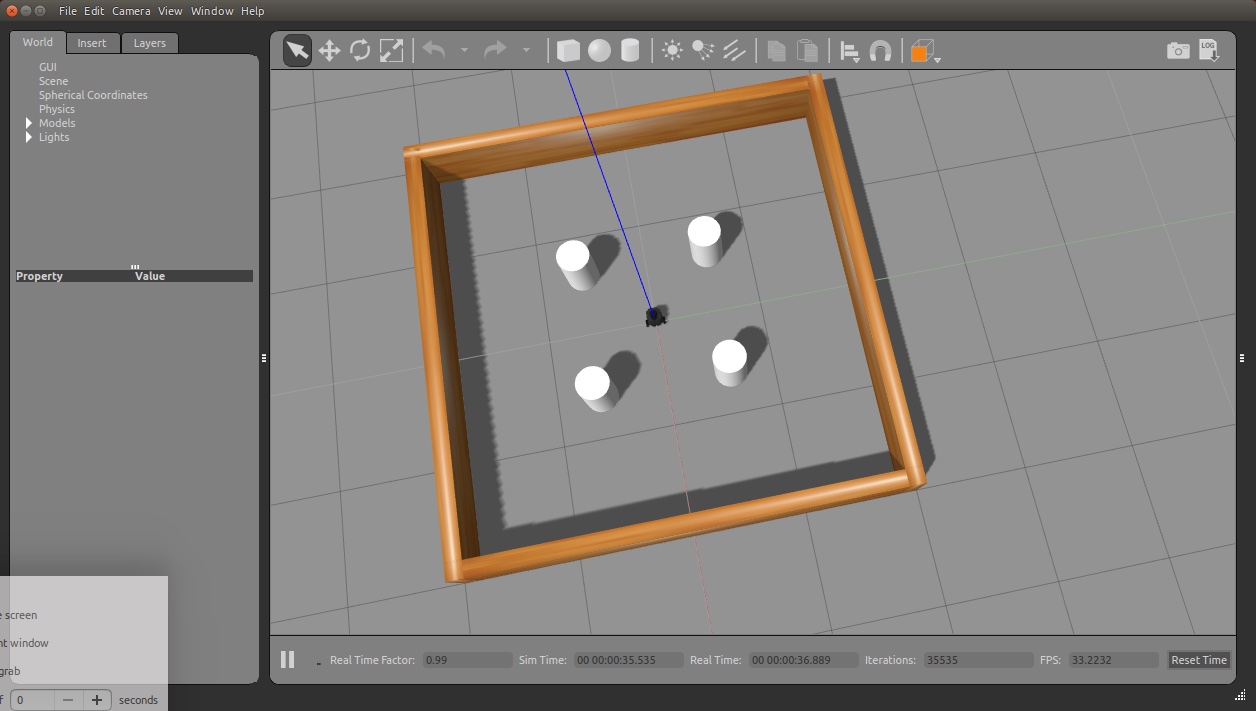
- As we are working with a simulated robot (not a physical one) we need a simulator
- Gazebo is the app that both creates a complete simulation and renders it graphically
- The simulation includes both a simulated robot and simulated obstacles
- The simulated robot generates all the topics that are needed
- It has a simulated lidar which will generate /scan topics
- It has a simulated base and wheels which will respond to /cmd_vel topics
- And the simulated base also generates /odom topics
- The obstacles are simulated so that they bounce the simulated lidar
- And they also are solid so that the simulated robot will not drive ‘through’ them!
- Lab instructions: Launch and capture data in a bag
- Launch Gazebo simulator with a basic Turtlebot3 World
$ roslaunch turtlebot3_gazebo turtlebot3_stage_3.launch
- Lab Instruction: Save all the messages
- We are going to save all the topics published by the simulated robot. plus a timestamp
- With that we will be able to run other nodes and algorithms against the exact same experience
- If we ran the simulation over and over again, it would be different and not a good baseline
- We use rosbag to save all /odom, /tf and /scan messages
- We don’t need to save /cmd_vel (why?)
$ rosbag record -O data.bag /scan /tf /odom
- Lab instructions: Teleop through the space
- Help the robot ‘see’ the whole space
- As long as we are recording a rosbag and the simulation (gazebo) is running, all messages are saved
- Use teleop to visit enough of the space so that all surfaces to be mapped are within unobstructed view
- Exit with ^c
$ roslaunch turtlebot3_teleop turtlebot3_teleop_key.launch
- Lab Instruction: Save and inspect the rosbag
- Once you are satisfied you have visited the whole space
- Click ^c to stop saving topics to the bag and close the file
- Inspect the file and see if it looks reasoble
$ rosbag info data.bag
Introduction to SLAM using the saved map
- Lab Instruction: Use collected data to run SLAM and build a map
- We run the (one of several) map making modules, gmapping
- The map making module conceptually is monitoring the messages and figuring out a map of the space
- In our case, the messages are being generated by “playing” the bag
- What about ‘time’? Instead of the wall clock, ROS will now get time from the bag too
- So there are three steps:
- Run roscore
- Change the time source to the simulation
- Run the map maker package
- Play the messages that we recorded before
NB Check that you've killed all ROS-related processes.
$ roscore
$ rosparam set use_sim_time true
$ roslaunch turtlebot3_slam turtlebot3_slam.launch slam_methods:=gmapping
$ rosbag play --clock data.bag
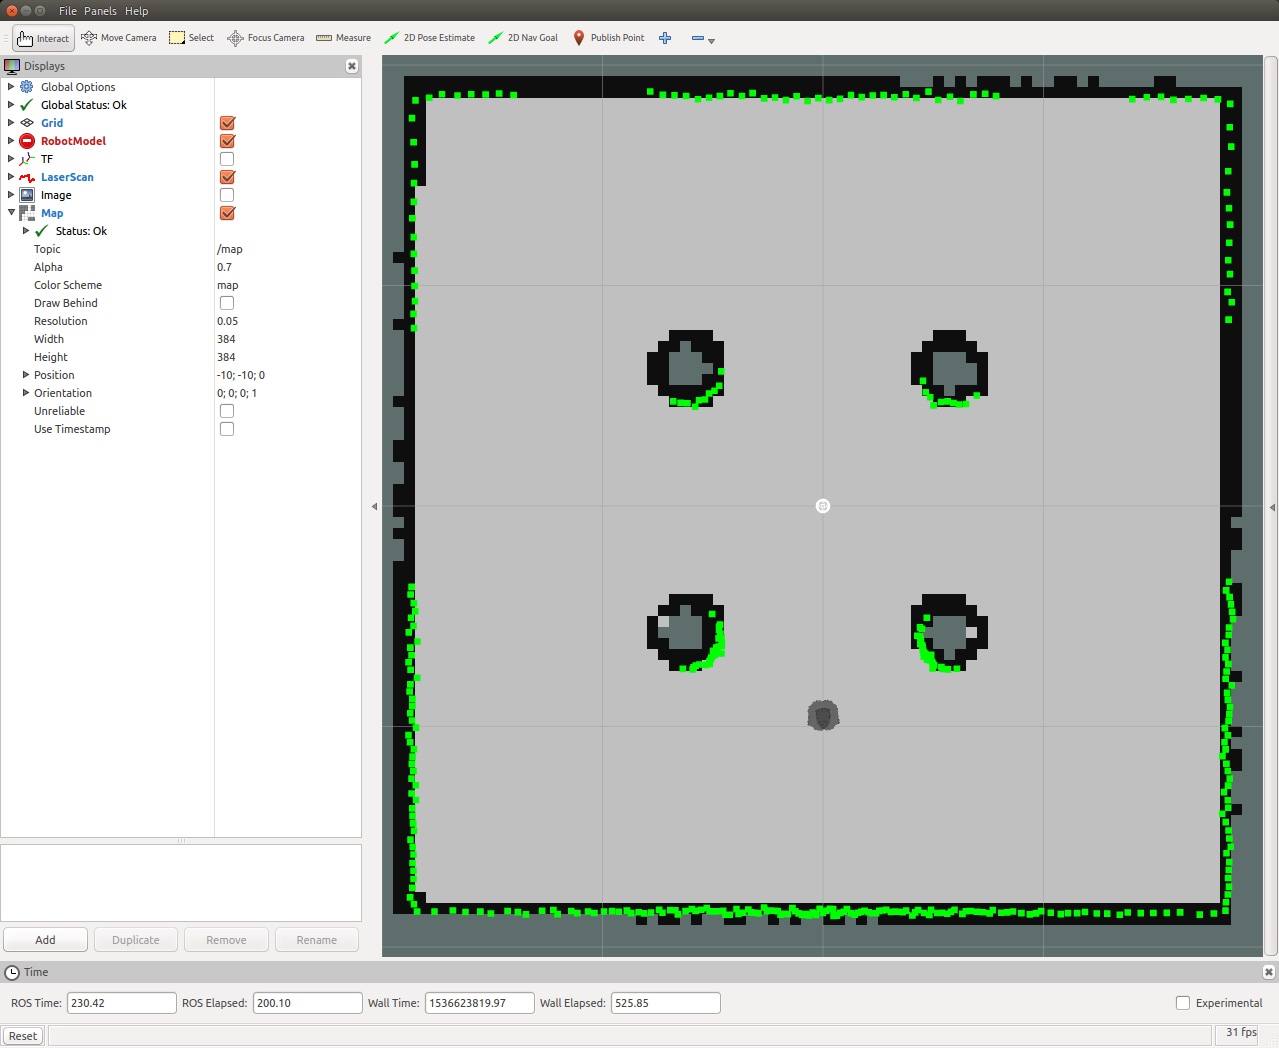
- Lab Instruction: Save and look at the map
- Once the rosbag has been fully played, you should see the constructed map
- The map is still just in memory
- If you ^c gmapping right now, the map would be lost
- We will do the following steps:
- Save the map using map_server
- Stop mapping by quitting slam_gmapping
- use_sim_time -> false
- Serve up the newly created map with map_server
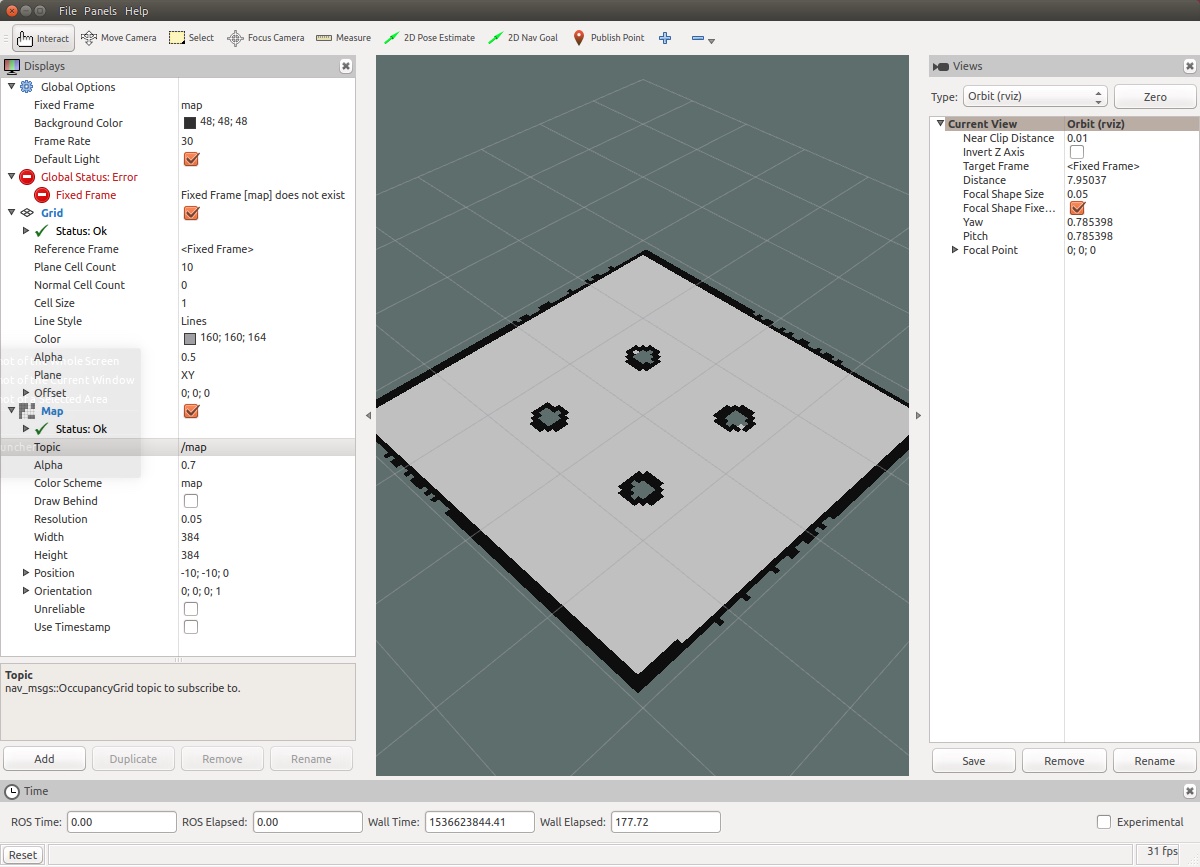
- Inspect the map with rviz.
- Important: once in rviz you need to app a Map pane, and set the map topic to /maps
$ rosrun map_server map_saver -f stage3
$ rosparam set use_sim_time false
$ rosrun map_server map_server stage3.yaml
$ rosrun rviz rviz
Summary and Conclusion
- Used slam_gmapping package to create a map of a simulated world
- We only touched on the “art” of tuning the map to get the most useful map for our purposes
- On the Gmapping Wiki Page
References for further study
- Learning Particle Filters: Particle Filters Explained Without Math
 (random Image from picsum.photos)